The presence of snow cover has a large impact in many areas such as the Arctic ecosystems, human activities, atmospheric processes and the Earth’s surface energy balance. The seasonal snow cover is sensitive to temperature changes. The Arctic is warming faster than any other region on Earth, and the observed climate changes for Svalbard are severe. A snow cover index for Svalbard - a time series of total snow-covered area - is highly relevant and of interest for a wide range of fields. It is challenging to map the snow cover for larger regions due to its large spatial and temporal variability and its changing properties influenced by temperature, precipitation and wind. Also the sparse number of weather stations with snow cover measurements contributes to a poor observational base. By using satellite monitoring it is possible to get a better overview of the snow condition on land. Regular satellite observations have been available since the early 1980’s.
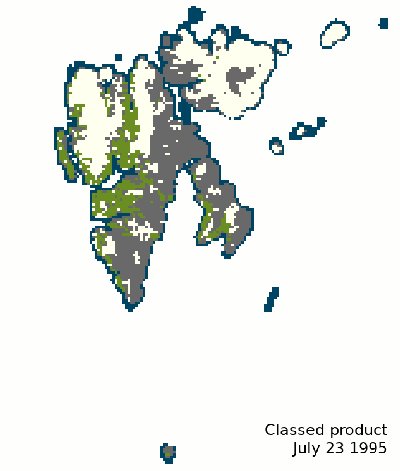
In the SIOS access project “Validation of a satellite based Snow Cover Index for Svalbard (SvalSCE)” we have derived daily snow cover maps for Svalbard from a 34 year long time series of satellite data. We have used a climate calibrated satellite data record from the Advanced Very High Resolution Radiometer (AVHRR) instrument. The daily maps cover the period 1982 - 2015, from March 1st to September 30th each year. The AVHRR instrument measures reflected sunlight, which means that we cannot produce snow cover maps during polar night. Figure 1 shows an example of a snow cover map, taken from July 23rd 1995. The white areas are snow cover, green areas are snow-free land, and grey areas were cloud-covered on this day.
Svalbard’s northerly location means that the sun never reaches high in the sky. Low solar elevation is challenging from a remote sensing point of view due to cloud shadows, mountain shadows and shadowed landscape. To assess the quality of the snow cover maps we have collected available data records for ground observations of snow depth and snow cover from the SIOS data portal and other sources. This ground data is used for comparison.The project report contains a thorough description of the validation work and results.
The AVHRR instrument cannot see through clouds. On most days there will be some cloud-covered areas, and we cannot know for sure whether the ground below is snow-free or snow-covered. One aim of this project was to investigate whether the snow maps indicate changes in the total snow cover with time. To do this we need to make some assumptions for the cloud-covered areas: we insert the nearest in time cloud-free observation (i.e., either snow-covered or snow-free). In this way we can have an estimate of the total snow cover on Svalbard for each day of the period covered by the satellite data product. Figure 2 shows the ratio of total snow cover for the Svalbard archipelago for some selected years. The daily value was averaged over 9 days to reduce noise.
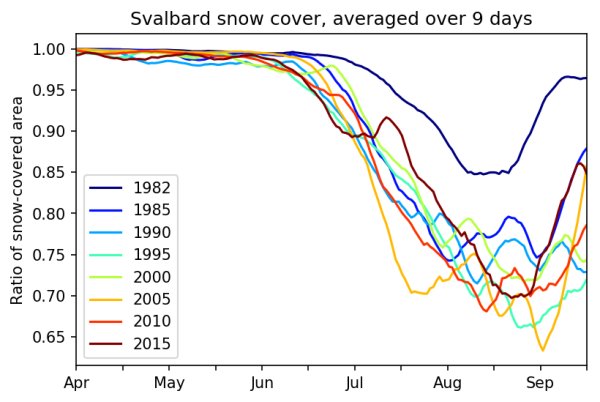
Figure 2 shows that Svalbard is more or less completely snow-covered up until melting starts sometime in ~June each year. Through summer the total snow cover is reduced to a minimum level somewhere in the range of 60-80% snow cover.
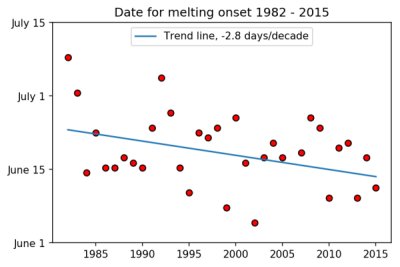
We introduce a definition of melt onset as the day of year for which the total snow-covered area drops below 97% of fully snow-covered. From this assumption we find that melting starts 2.8 days earlier per decade. This means that over the 34 years covered by this satellite data record melt onset has shifted by more than a week.[1] Figure 3 shows the date for melt onset for each year of the period 1982-2015.
The dataset will shortly be available for download through the SIOS data portal.
The project report is available here.
[1] please note that these dates and numbers are sensitive to the definition for melt onset that we have introduced.
