The arctic environment is changing rapidly, as global warming reduces the seasonal snow cover. More solar energy is absorbed by the remaining darker surface, promoting further warming. This feedback makes the reduction of the arctic snow cover a major influence on the climate system. Despite this importance, we know little about the arctic snow cover at scales below the current satellite resolution. Yet, it is these local scale snow properties which largely control parameters such as subsurface temperature and stream runoff. In this context, the snow water equivalent (SWE) is one of the most important variables to consider. It indicates the water column that would theoretically result should the whole snow pack melt instantaneously.
The SIOS project “Near real-time observations of snow water equivalent for SIOS on Svalbard – (SWESOS)” evaluates SWE measurements using a new automated sensor, together with automated snow height measurements, time-lapse camera images and field observations at the Bayelva long term observational site close to Ny-Ålesund over the winter period 2019/2020. The aim is to increase the ease with which the SWE can be monitored and thus confront the current lack of continuous observations of snow properties at high latitudes. The team was lead by Julia Boike and Katharina Jentzsch (Alfred Wegener Institute for Polar and Marine Research, AWI), in collaboration with Sebastian Westermann (University of Oslo), Jean-Charles Gallet (Norwegian Polar Institute), Niko Bornemann (AWI), William Cable (AWI) and Stephan Lange (AWI).
The full project report is available here.
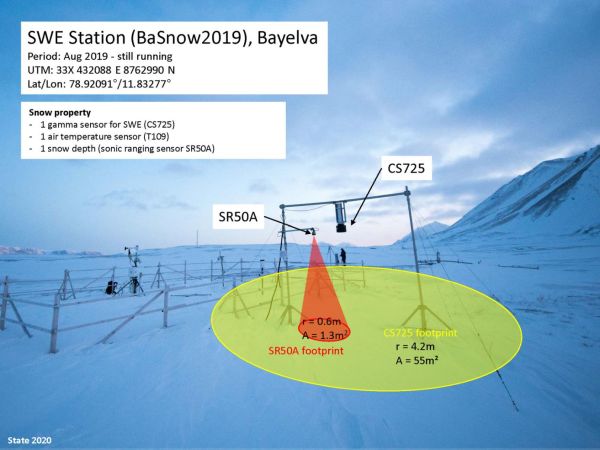
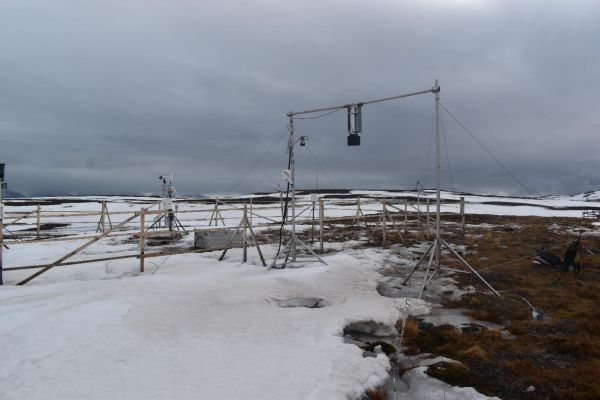
The automated sensor calculates the SWE by measuring the attenuation of gamma rays naturally emitted from the ground. At the given installation height the instrument monitors the SWE of a surface area of up to ∼55 m2. Inside this area, manual measurements of SWE and snow depth were performed to validate the automated records. Figure 1 shows the instrument setup of the Bayelva SWE station including a schematic illustration of the source areas of the snow depth and SWE information.
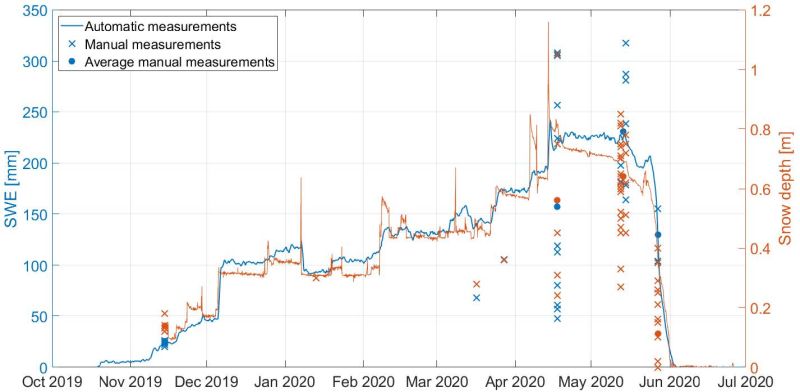
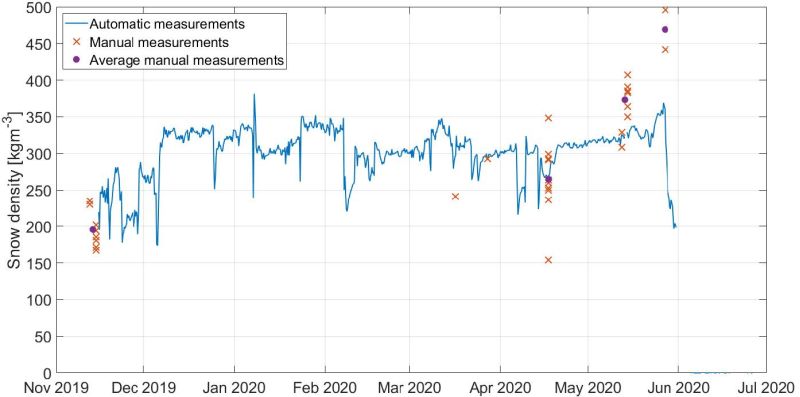
Figure 2 shows the evolution of the automated SWE and snow depth records over the winter period compared to the sporadic manual snow pit measurements. As expected the courses of snow depth and SWE are very similar. The large spread between simultaneous manual measurements indicates a high spatial variability of SWE and snow depth within the footprint area of the automated SWE sensor at times exceeding the temporal variation over the whole winter period (also see Figure 3). However, the automatic measurements are always within the range of the manual measurements. We furthermore combined the SWE and snow depth measurements to derive a continuous time series of the snow pack density (Figure 4).
We were able to verify the general course of the snow depth and SWE as provided by the automated sensors using independent meteorological measurements from the nearby climate monitoring station. The high spatial variability of the observed snow properties on the one hand limits the representativeness of the small-scale measurements of larger areas but on the other hand underlines the importance of continuous local-scale observations.
We merged our measurements into a unique dataset linking existing snow data with the new SWE records, which will shortly be available for download and linked through the SIOS data portal.
