NY-ålesund TurbulencE Fiber-Optic eXperiment (NYTEFOX) at the AWIPEV Research Base in Ny-Ålesund / Spitsbergen
temperatures and wind speeds in time and space.
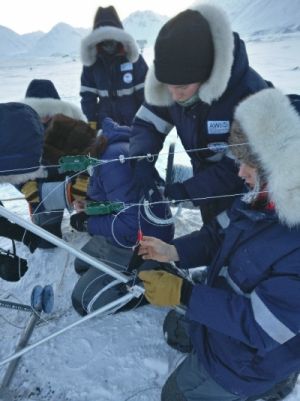
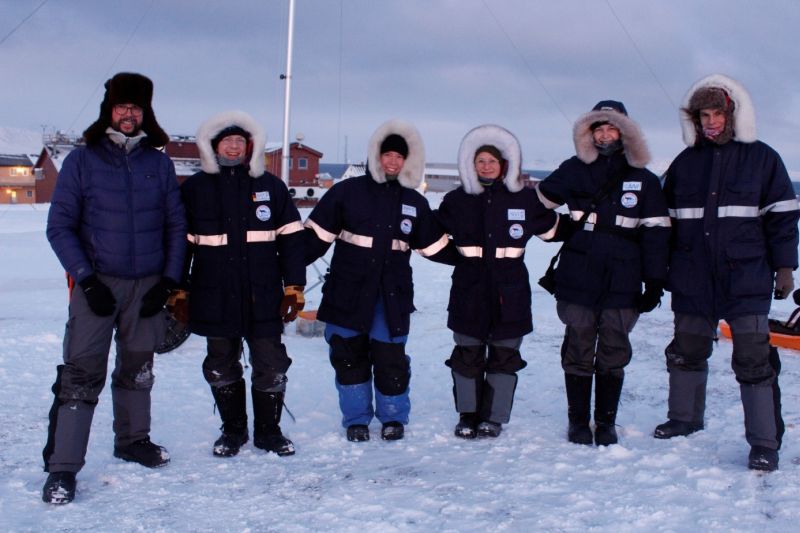
Photo credit: Irene Suomi (FMI, Finland).
The behavior of the atmosphere during daylight hours, when it is usually well mixed by small whirls, is well understood. But what happens when it’s dark after sunset or during polar night and winds calm down? Here we understand little, one of the reasons being that classic meteorological point measurements from single instruments cannot observe the whirls responsible for exchange of heat and evaporation. This information is needed to forecast both weather and climate more accurately, as well as explain the large warming in the Arctic.
NYTEFOX set out to fill this gap by using a recently developed technique to collect a unique dataset capturing all air motions: The team (Fig. 5) installed a Fiber Optic Distributed Sensing (FODS) array of about 1.4 km length consisting of thin (1 mm) white fiber-optic cables, similar to those used in telecommunication, south of the science station Ny-Ålesund, Svalbard (Fig. 1) and measured for 14 days in February and March 2020.
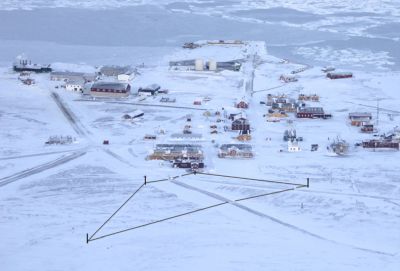
as seen from Zeppelin mountain on 29.02.2020.
Photo credit: Harald Sodemann (UBergen, Norway).
A FODS machine shoots laser pulses into the optical fiber and detects the returned light as it travels down the cable. The intensity of this backscatter contains information about the temperature of the location where the scattering occurred. Hence, temperature can be sensed continuously along the cable. If two parallel fibers are used with one being heated, also wind speed can be measured. The underlying principle uses the heat exchange between heated cable and air, which depends on the wind speed.
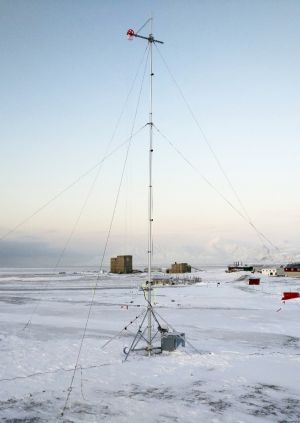
Most of the optical fiber was strung horizontally at around 1 m height (Fig. 2), but some of it was routed vertically on three towers over 10 m height at the corners (Fig. 3).
This FODS setup was the first of its kind at Ny-Ålesund. Our measurements demonstrated how temperatures vary depending on where the air comes from (glacier, fjord, land, settlement) and how it moves across the array, giving a unique insight into processes not visible to the naked eye (Fig. 4).
Combined with other classic instruments, we therefore started shedding light onto this ‘dark’ side of atmospheric motions, helping to improve our understanding, forecasting and modelling the Arctic atmosphere.
Thank you, SIOS, for supporting this unique scientific experiment, from the NYTEFOX team (Fig. 5)!
and other sensors devices.
Photo credit: Irene Suomi (FMI, Finland).
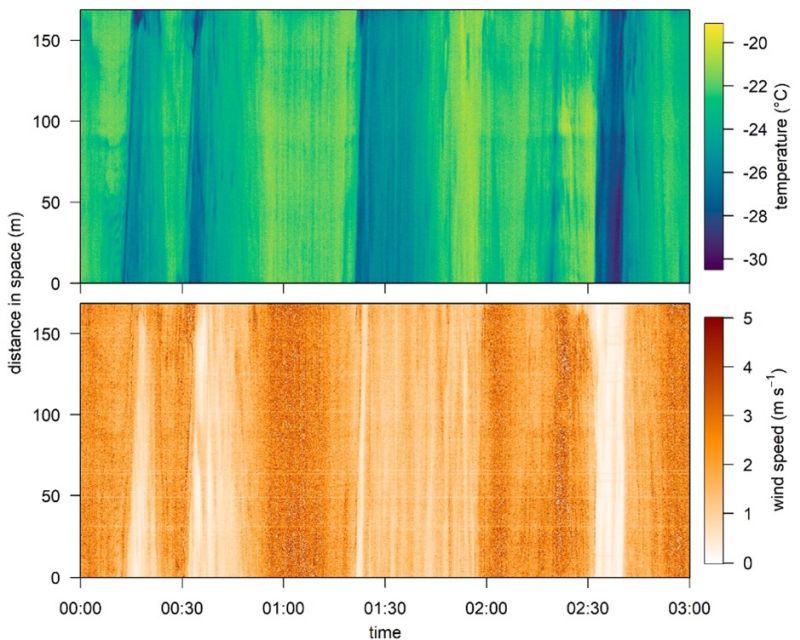
(lower plot) over time along a 170 m long leg of the fiber-optic array.
Danila Littmann2, and Jannis Huss1. 1Micrometeorology group, University of Bayreuth, ²Alfred Wegener Institute Potsdam.
